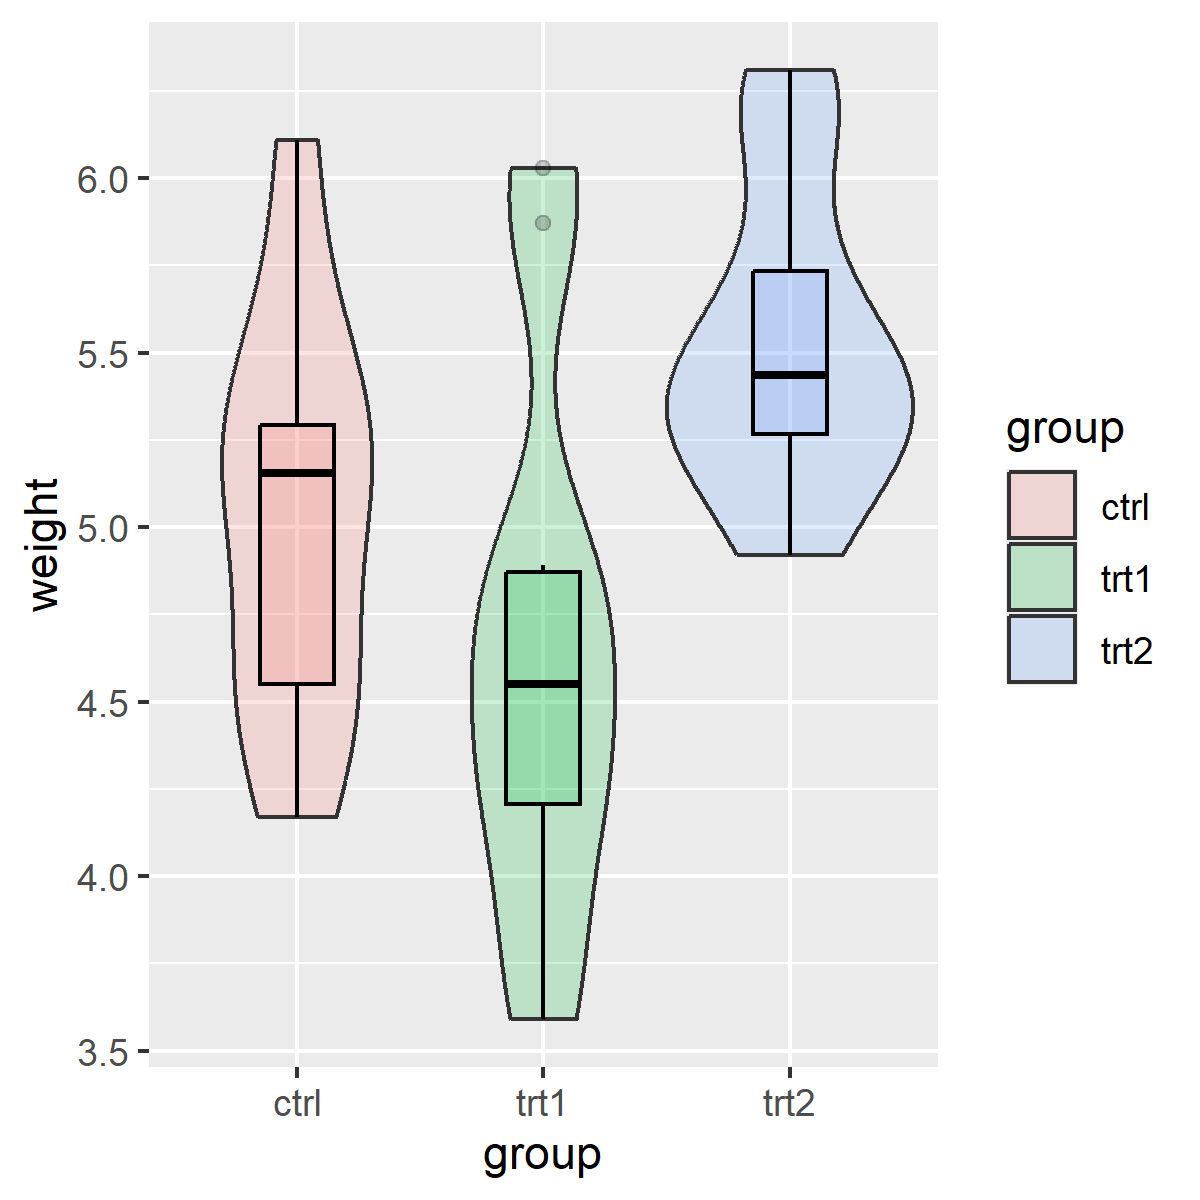
library(ggplot2)
png(filename = paste0(getwd(), "/p1.png"),
width = 4,
height = 4,
units = "in",
res = 300)
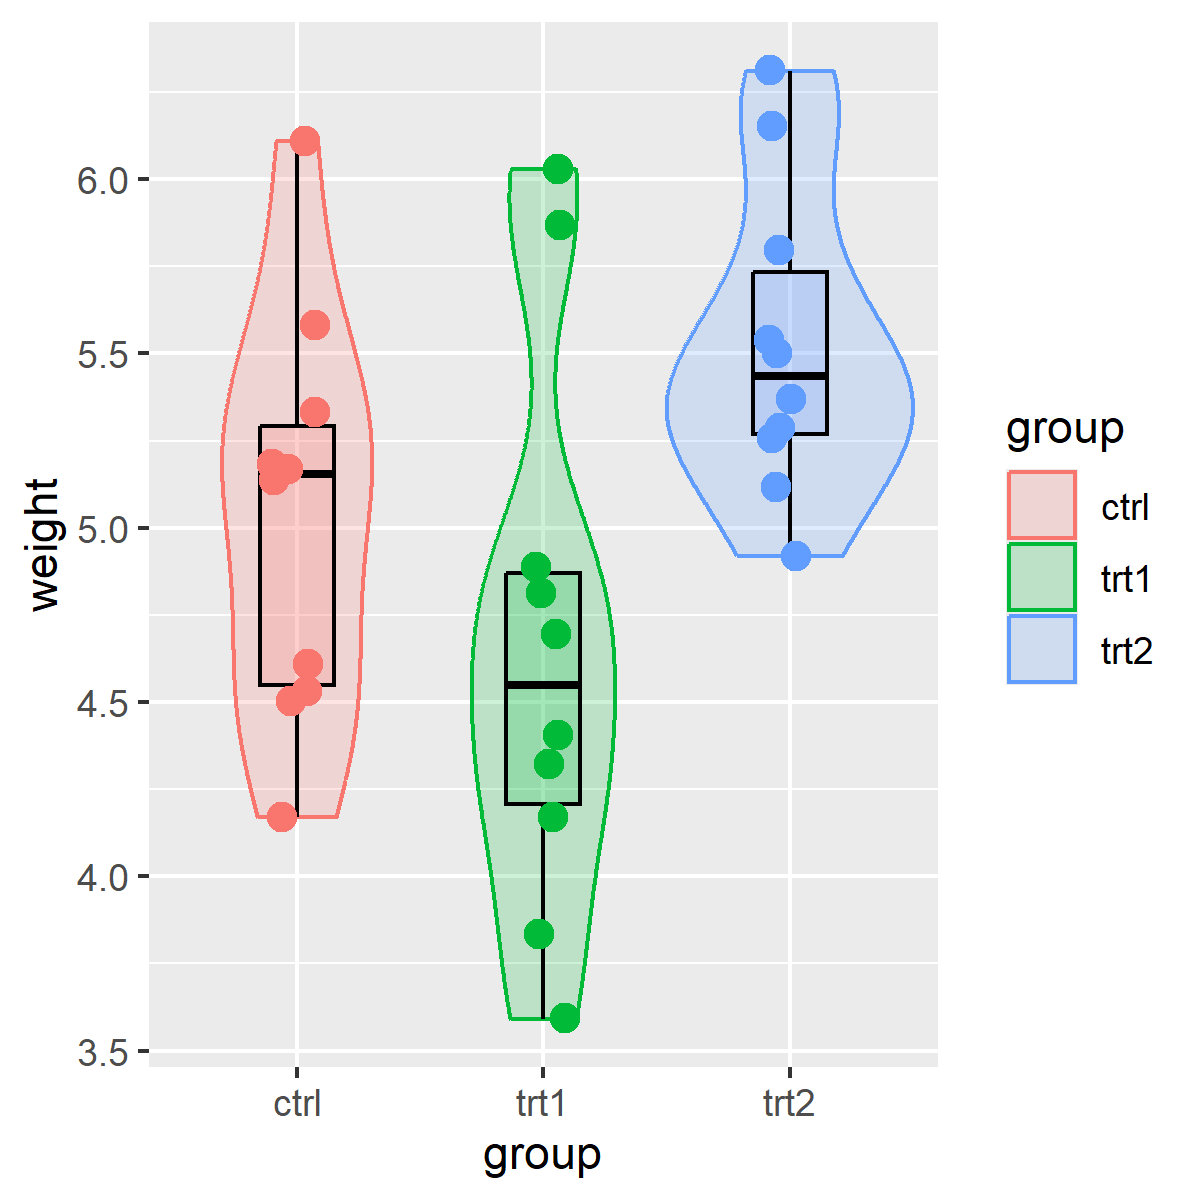
ggplot(data = PlantGrowth,
mapping = aes(x = group,
y = weight,
fill = group)) +
geom_violin(width = 1,
alpha = 0.2) +
geom_boxplot(width = 0.3,
color = "black",
alpha = 0.2,
show.legend = F)
dev.off()Boxplot and violin plot
boxplot
violin
Code 1
Code 2
library(ggplot2)

png(filename = paste0(getwd(), "/p2.png"),
    width = 4,
    height = 4,
    units = "in",
    res = 300)

ggplot(data = PlantGrowth,
       mapping = aes(x = group,
                     y = weight,
                     fill = group,
                     color = group)) +

geom_violin(width = 1,
            alpha = 0.2) +

geom_boxplot(width = 0.3,
             color = "black",
             alpha = 0.2,
             outliers = F, # ẩn outlier
             show.legend = F) +

geom_jitter(width = 0.1,
            size = 3,
            show.legend = F)

dev.off()