Bài tập vẽ bản đồ

Câu 1

Trên cơ sở bài tập gộp và làm sạch dữ liệu tỷ lệ sinh toàn cầu, ta có file dataset từ năm 2015 đến 2026 về tỷ lệ sinh của các quốc gia trên thế giới. total_fertility_rate_2015_2026.xlsx.

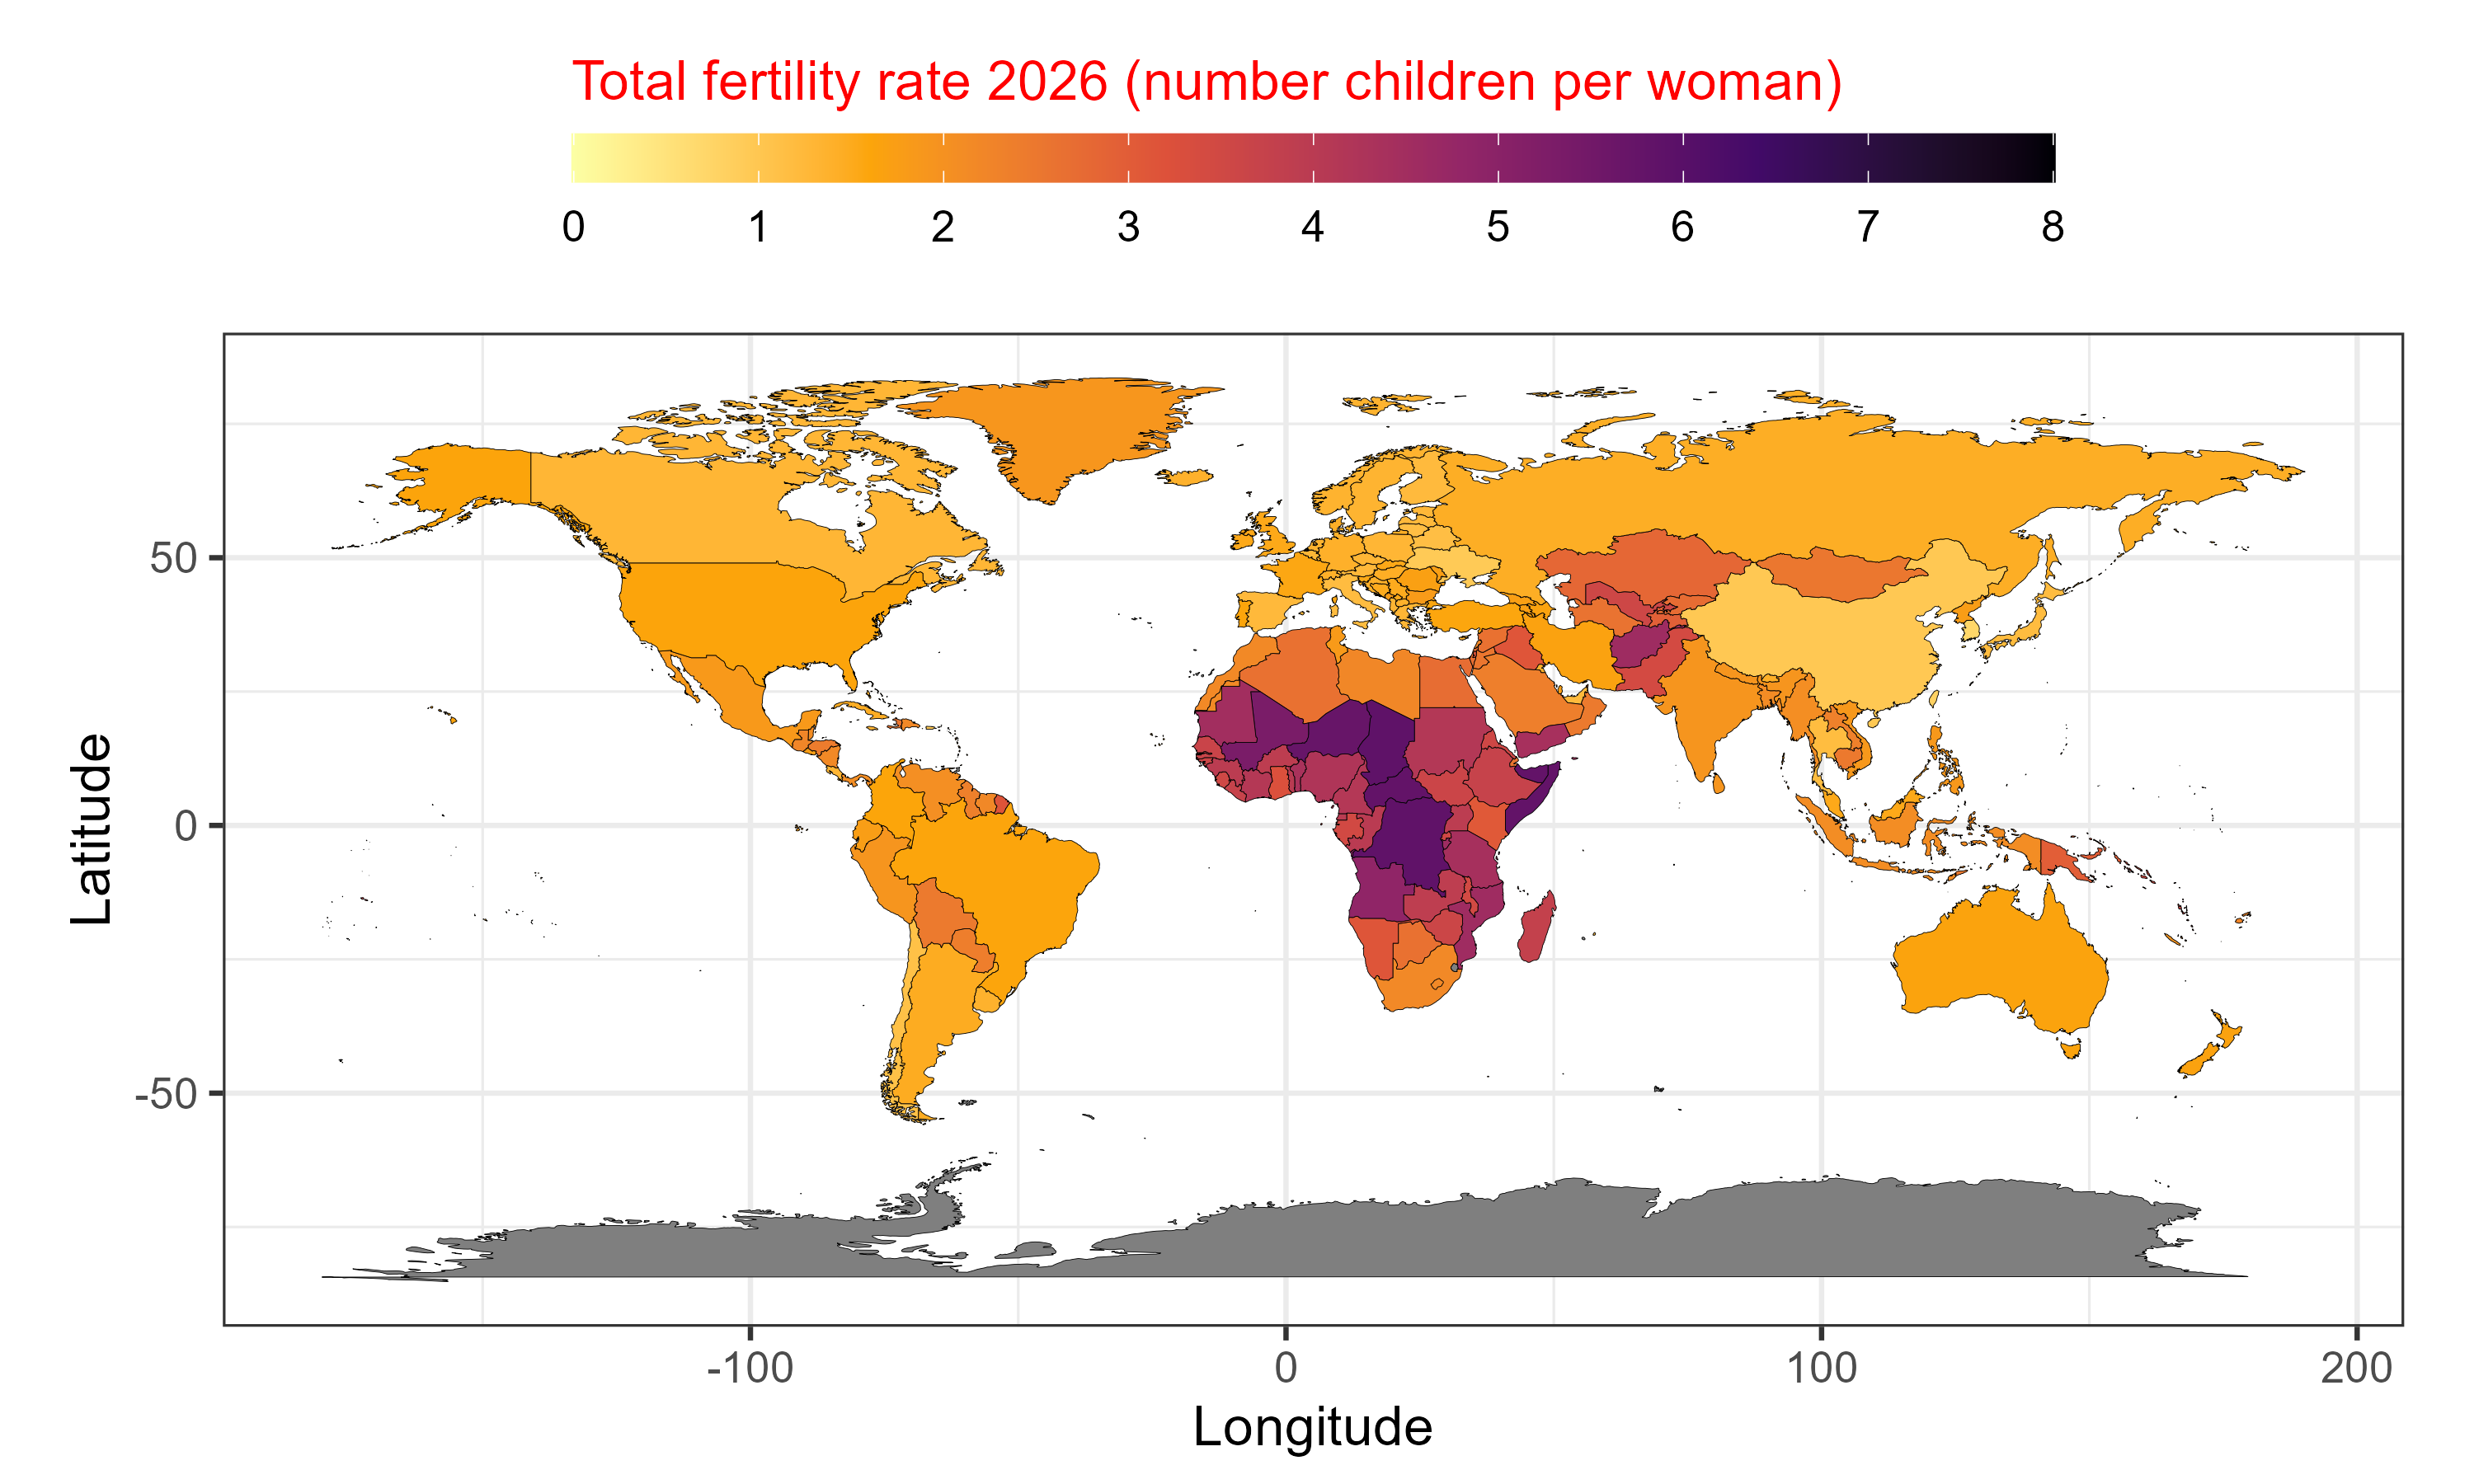
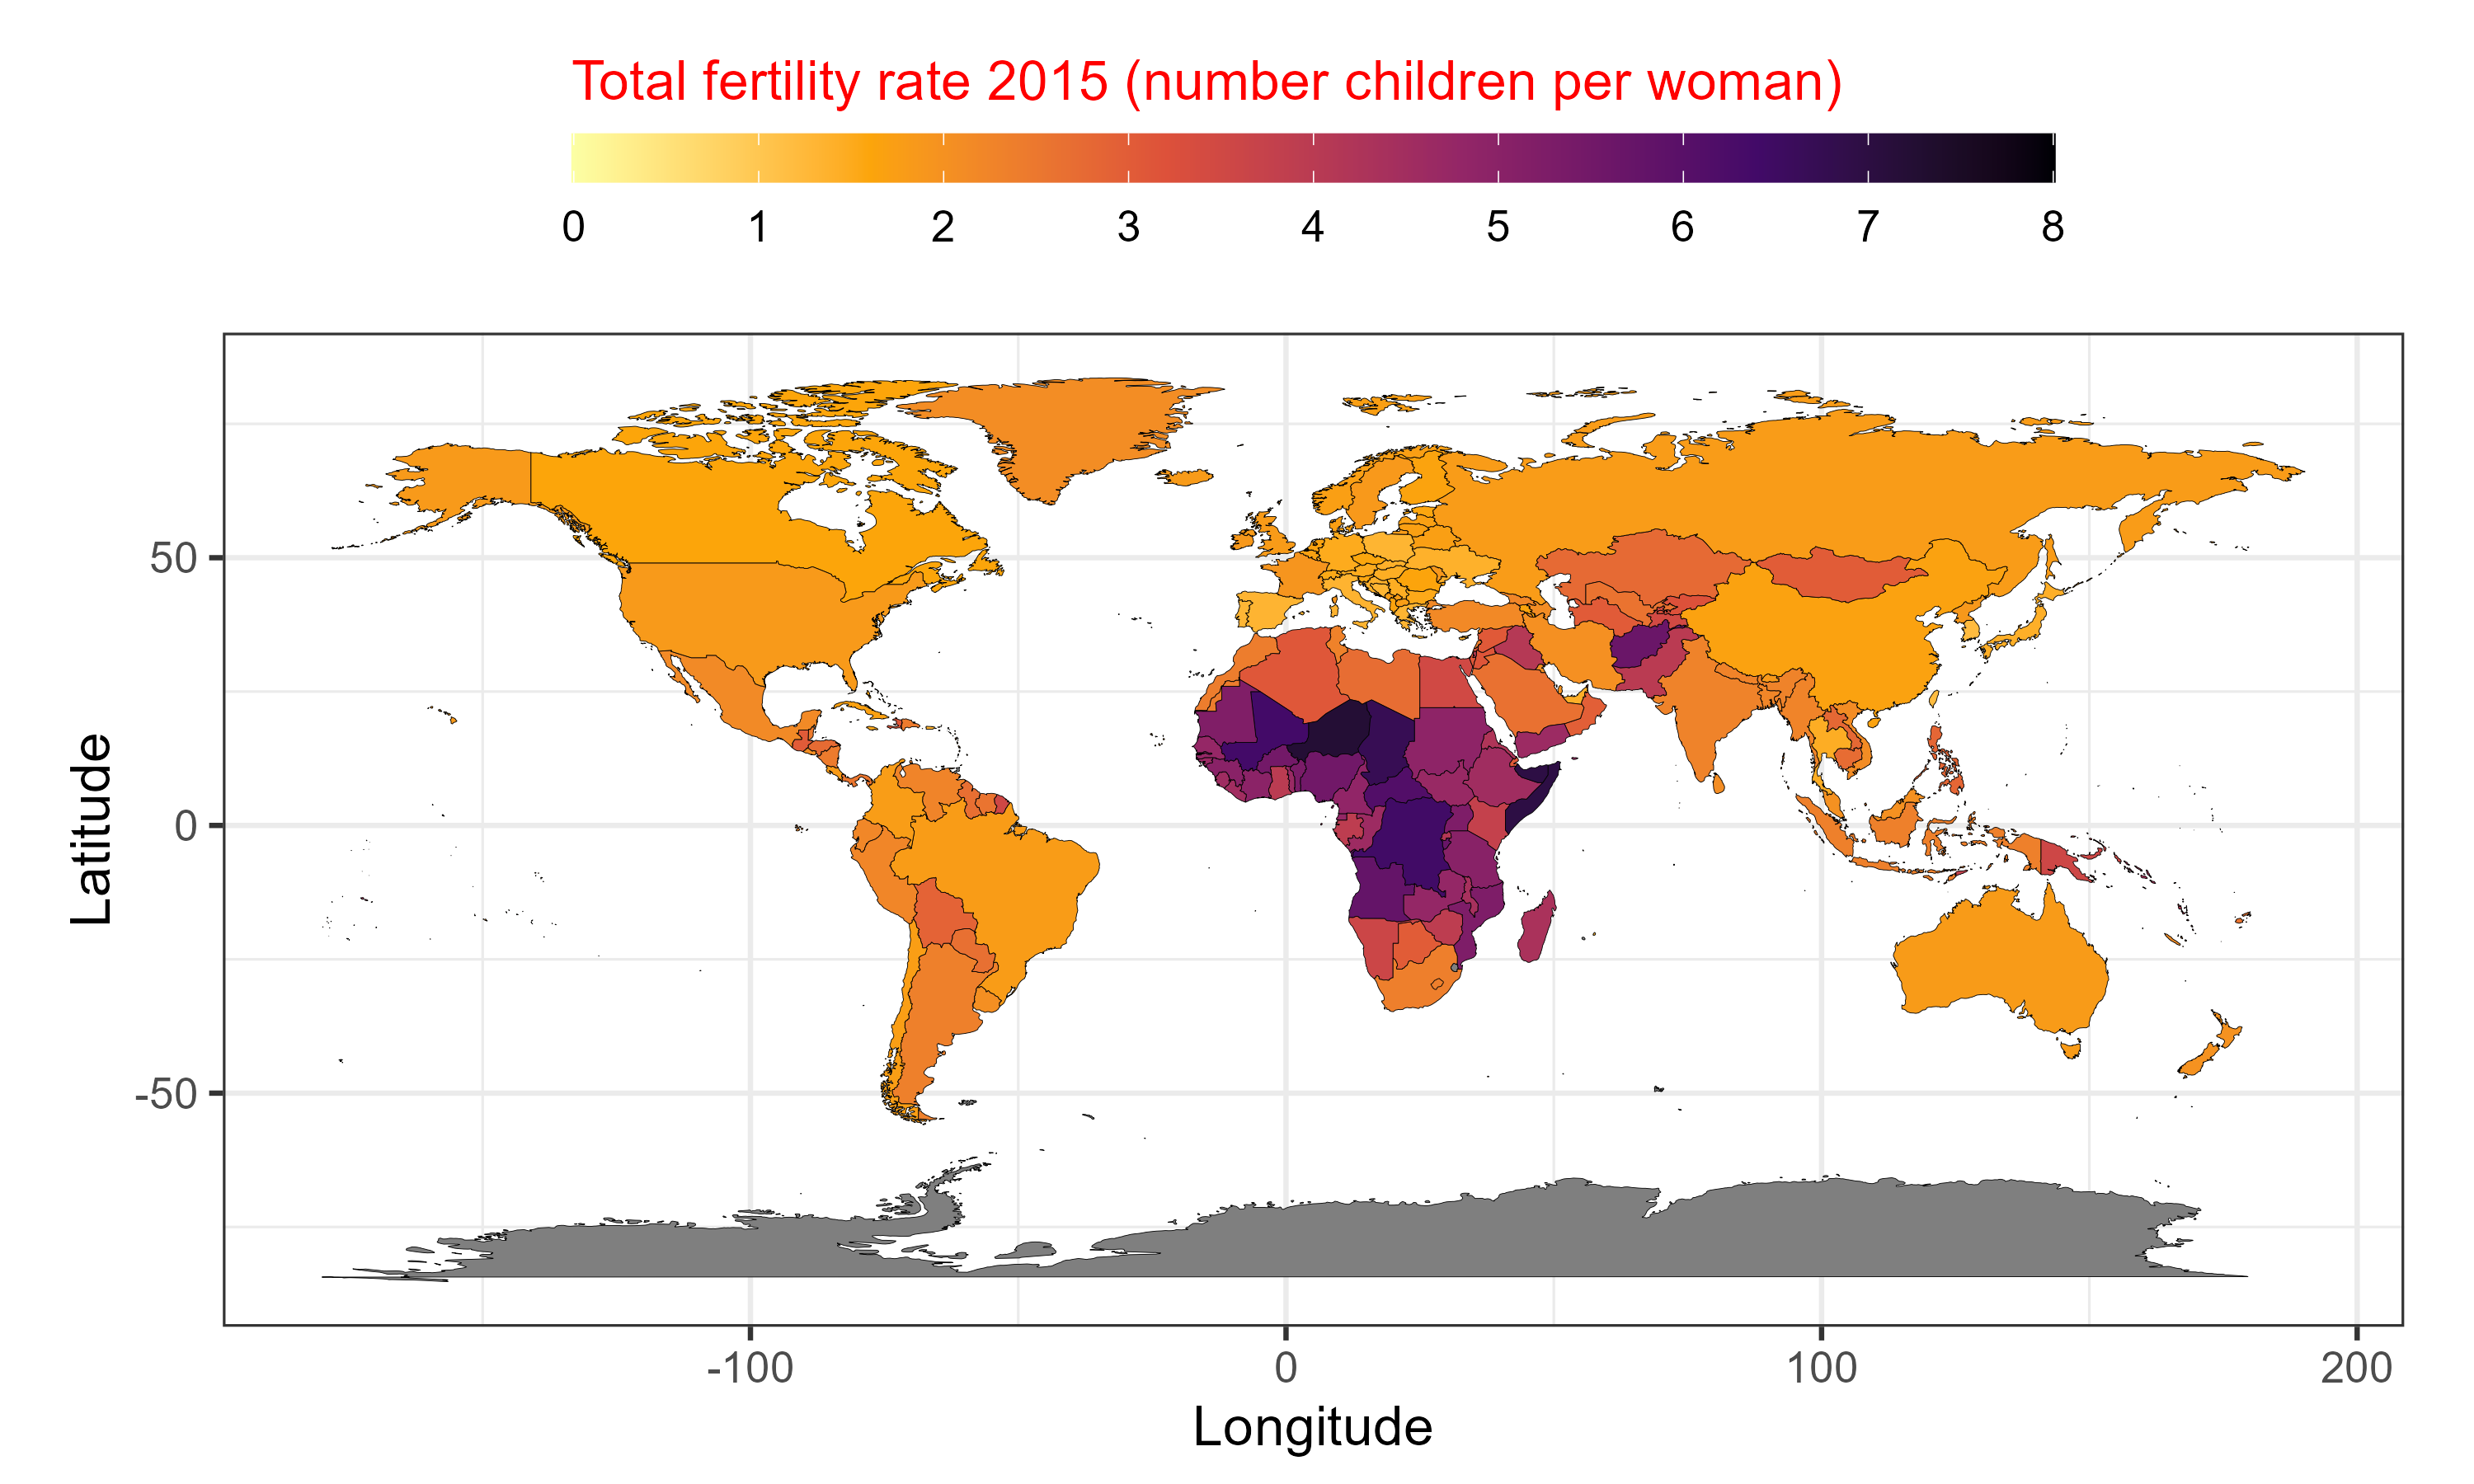
Bạn hãy trích xuất ra dữ liệu của hai năm 2015 và 2026 để vẽ bản đồ sau.

Gợi ý thực hiện:

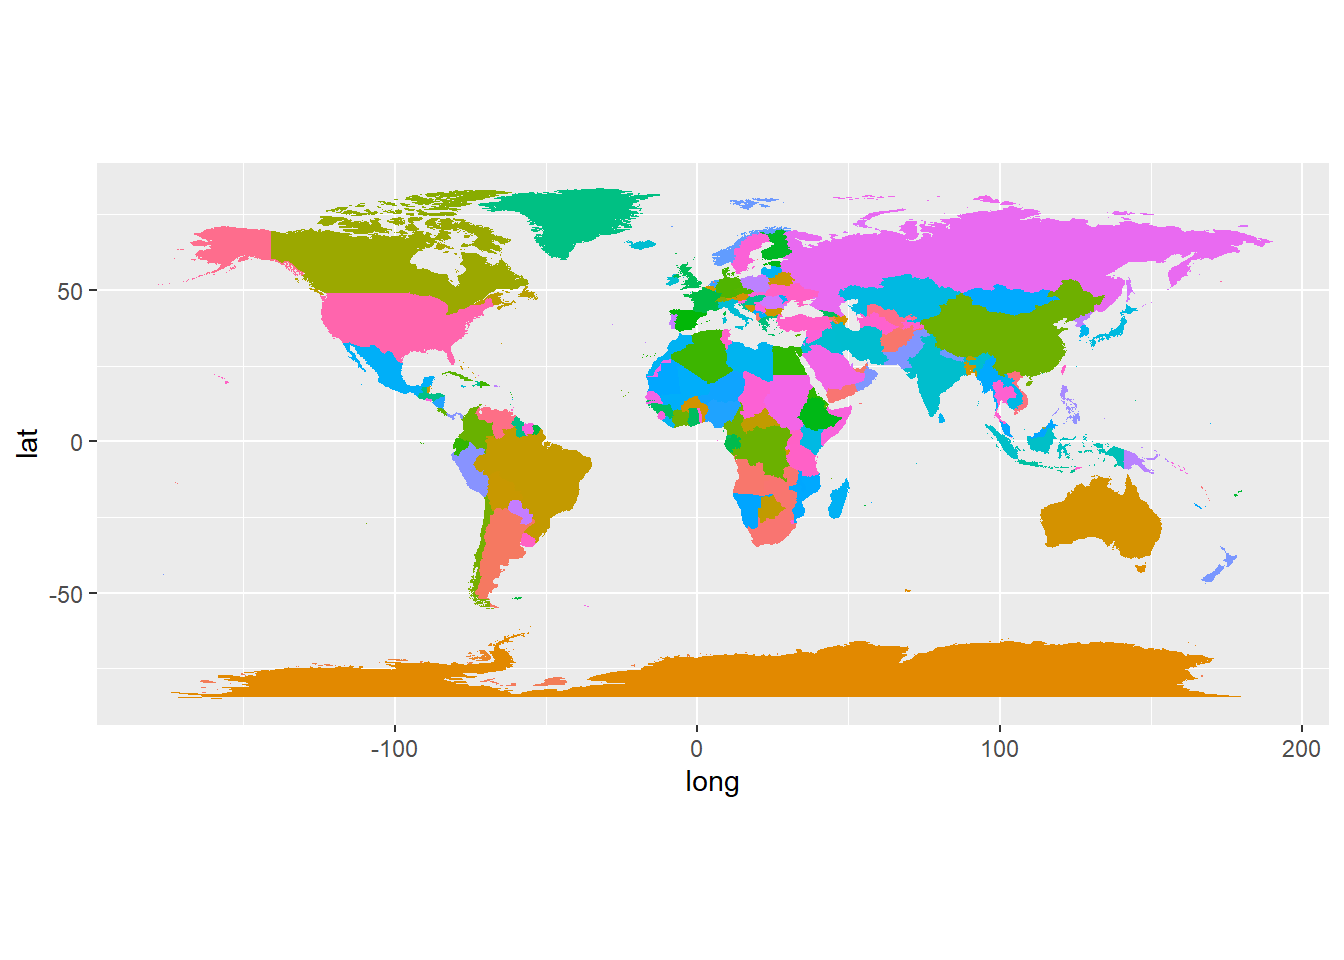
  • Bạn có thể sử dụng dataset worldmap để vẽ bản đồ nền bằng package ggplot2
library(ggplot2)
world <- ggplot2:::map_data("world")

set.seed(1)

ggplot() +
  
  geom_polygon(data = world,
               aes(x = long,
                   y = lat, 
                   group = group,
                   fill = as.factor(group))) + 
  
  coord_equal() +
  
  theme(legend.position = "none")

  • Một số tên quốc gia trong dataset total_fertility_rate_2015_2026.xlsx sẽ khác với trong dataset world bạn cần chuẩn lại cùng tên để có thể vẽ được bản đồ heatmap theo tỷ lệ sinh.

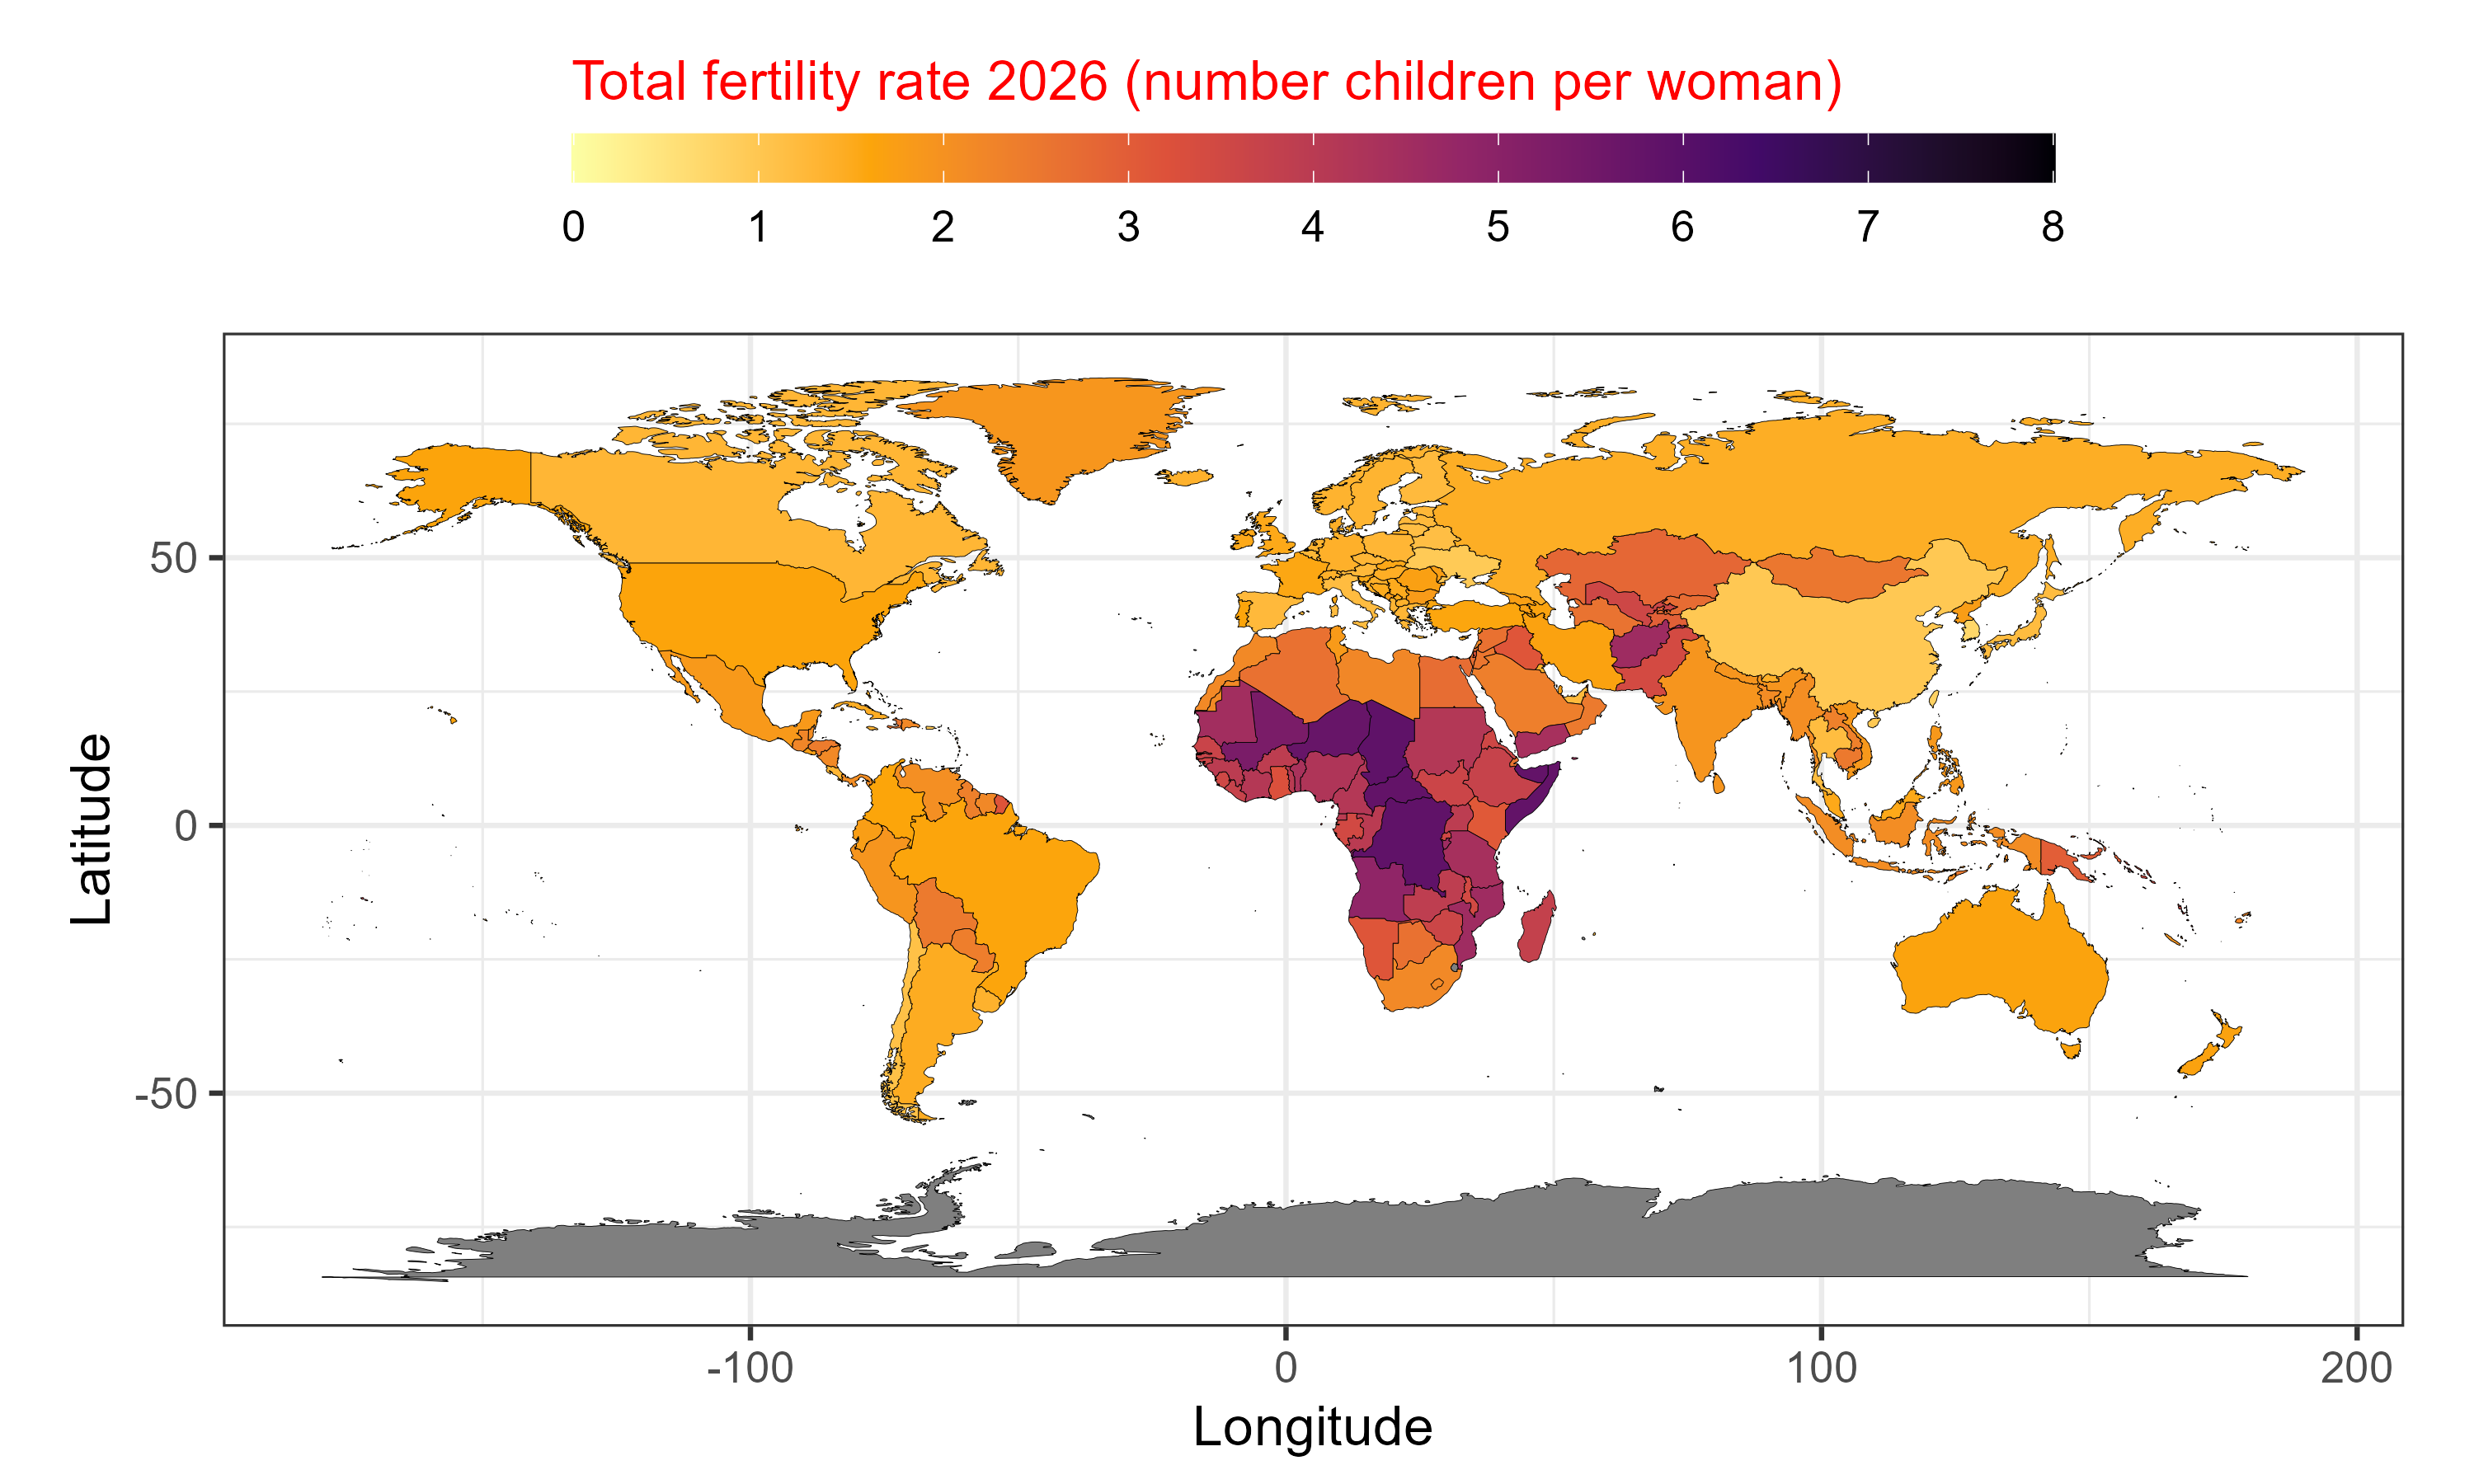
Đoạn code sau mình vẽ cho dữ liệu năm 2026

Import dataset

library(readxl)
df <- read_excel("dataset/total_fertility_rate_2015_2026.xlsx")
df <- as.data.frame(df)
df <- df |> subset(Year == "2026")

Import worldmap

library(ggplot2)
world <- map_data("world")

Chuẩn lại tên quốc gia

df_Antigua <- df |> subset(Country == "Antigua and Barbuda")
df_Antigua$Country <- "Antigua"

df_Barbuda <- df |> subset(Country == "Antigua and Barbuda")
df_Barbuda$Country <- "Barbuda"

df <- df |> subset(Country != "Antigua and Barbuda")

df <- rbind(df, df_Antigua, df_Barbuda)

row.names(df) <- NULL

df |> dplyr:::arrange(desc(Year), Country) -> df
df$Country[which(df$Country == "Brunei Darussalam")] <- "Brunei"
df$Country[which(df$Country == "United States")] <- "USA"
df$Country[which(df$Country == "United Kingdom")] <- "UK"

df$Country[which(df$Country == "Republic of Moldova")] <- "Moldova"

df$Country[which(df$Country == "Bonaire, Sint Eustatius and Saba")] <- "Bonaire"

df$Country[which(df$Country == "Congo, Democratic Republic of the")] <- "Democratic Republic of the Congo"

df$Country[which(df$Country == "Congo")] <- "Republic of Congo"

df$Country[which(df$Country == "Curaçao")] <- "Curacao"

df$Country[which(df$Country == "British Virgin Islands" )] <- "Virgin Islands"

df$Country[which(df$Country == "State of Palestine" )] <- "Palestine"

df$Country[which(df$Country == "Cabo Verde" )] <- "Cape Verde"

df$Country[which(df$Country == "Syrian Arab Republic" )] <- "Syria"

df$Country[which(df$Country == "Trinidad and Tobago" )] <- "Tobago"

df$Country[which(df$Country == "Côte d'Ivoire" )] <- "Ivory Coast"

Setdiff

Kiểm tra xem tên quốc gia ở hai dataset có khác biệt không để clean lại lần nữa.

unique(world$region) -> country_map

unique(df$Country) -> country_tfr

setdiff(country_tfr, country_map) # ten quoc gia co trong tfr nhung ko co trong country_map
 [1] "China, Hong Kong SAR"             "China, Macao SAR"                 "Eswatini"                         "Falkland Islands (Malvinas)"      "Gibraltar"                       
 [6] "Micronesia (Fed. States of)"      "Réunion"                          "Saint Barthélemy"                 "Saint Kitts and Nevis"            "Saint Martin (French part)"      
[11] "Saint Vincent and the Grenadines" "Sint Maarten (Dutch part)"        "Tokelau"                          "Tuvalu"                           "United States Virgin Islands"    
[16] "Wallis and Futuna Islands"       
setdiff(country_map, country_tfr) # ten quoc gia co trong country_map nhung ko co trong tfr
 [1] "Antarctica"                          "French Southern and Antarctic Lands" "Saint Barthelemy"                    "Canary Islands"                      "Falkland Islands"                   
 [6] "Reunion"                             "Micronesia"                          "Heard Island"                        "Cocos Islands"                       "Christmas Island"                   
[11] "Chagos Archipelago"                  "Siachen Glacier"                     "Nevis"                               "Saint Kitts"                         "Saint Martin"                       
[16] "Norfolk Island"                      "Sint Eustatius"                      "Saba"                                "Pitcairn Islands"                    "Madeira Islands"                    
[21] "Azores"                              "South Sandwich Islands"              "South Georgia"                       "Ascension Island"                    "Swaziland"                          
[26] "Sint Maarten"                        "Trinidad"                            "Vatican"                             "Grenadines"                          "Saint Vincent"                      
[31] "Wallis and Futuna"                  

Chuẩn cột Total_fertility_rate

gsub(pattern = " per woman",
     replacement = "",
     df$Total_fertility_rate) -> df$Total_fertility_rate

df$Total_fertility_rate <- as.numeric(df$Total_fertility_rate)
names(df)[2] <- "region"

Merge

world_ok <- merge(x = world,
                  y = df[ , 2:3],
                  all.x = TRUE,
                  by = "region")
world_ok <- world_ok[ , c(names(world), "Total_fertility_rate")]
world_ok |> dplyr:::arrange(order) -> world_ok
identical(sort(world_ok$order), sort(world$order))
[1] TRUE
identical(world_ok$order, world$order)
[1] TRUE
summary(df$Total_fertility_rate)
   Min. 1st Qu.  Median    Mean 3rd Qu.    Max. 
  0.645   1.425   1.895   2.264   2.791   5.865 
# những quốc gia không có thông tin tỷ lệ sinh
world_ok_NA <- world_ok[which(is.na(world_ok$Total_fertility_rate)) , ]
unique(world_ok_NA$region)
 [1] "Antarctica"                          "French Southern and Antarctic Lands" "Saint Barthelemy"                    "Canary Islands"                      "Falkland Islands"                   
 [6] "Reunion"                             "Micronesia"                          "Heard Island"                        "Cocos Islands"                       "Christmas Island"                   
[11] "Chagos Archipelago"                  "Siachen Glacier"                     "Nevis"                               "Saint Kitts"                         "Saint Martin"                       
[16] "Norfolk Island"                      "Sint Eustatius"                      "Saba"                                "Pitcairn Islands"                    "Madeira Islands"                    
[21] "Azores"                              "South Sandwich Islands"              "South Georgia"                       "Ascension Island"                    "Swaziland"                          
[26] "Sint Maarten"                        "Trinidad"                            "Vatican"                             "Grenadines"                          "Saint Vincent"                      
[31] "Wallis and Futuna"                  

Plot

worldplot <- ggplot() +
  
  geom_polygon(data = world_ok,
               aes(x = long,
                   y = lat, 
                   group = group,
                   fill = Total_fertility_rate),
               color = "black",
               lwd = 0.1) + 
  
  coord_equal() +
  scale_fill_viridis_c(option = "B",
                       direction = -1,
                       name = "Total fertility rate 2026 (number children per woman)",
                       limits = c(0,8),
                       breaks = c(0:8),
                       guide = guide_colorbar(barwidth = 30,
                                              barheight = 1)) +
  
  
  theme_bw(base_size = 16) +
  
  theme(legend.position = "top") +
  
  theme(legend.direction = "horizontal") +
  
  theme(legend.title.position  = "top") +
  
  theme(legend.title  = element_text(color = "red",
                                     size = 16)) +
  
  labs(x = "Longitude",
       y = "Latitude")
# worldplot

# ggsave(filename = "worldplot_2026.png",
#        plot = worldplot,
#        width = 10,
#        height = 6,
#        dpi = 300,
#        units = "in")