Từ khóa: confidence interval
Câu 1
Bạn có dữ liệu sau về thông số đo lường của 31 cây black cherry.
   Girth Height Volume
1    8.3     70   10.3
2    8.6     65   10.3
3    8.8     63   10.2
4   10.5     72   16.4
5   10.7     81   18.8
6   10.8     83   19.7
7   11.0     66   15.6
8   11.0     75   18.2
9   11.1     80   22.6
10  11.2     75   19.9
11  11.3     79   24.2
12  11.4     76   21.0
13  11.4     76   21.4
14  11.7     69   21.3
15  12.0     75   19.1
16  12.9     74   22.2
17  12.9     85   33.8
18  13.3     86   27.4
19  13.7     71   25.7
20  13.8     64   24.9
21  14.0     78   34.5
22  14.2     80   31.7
23  14.5     74   36.3
24  16.0     72   38.3
25  16.3     77   42.6
26  17.3     81   55.4
27  17.5     82   55.7
28  17.9     80   58.3
29  18.0     80   51.5
30  18.0     80   51.0
31  20.6     87   77.0
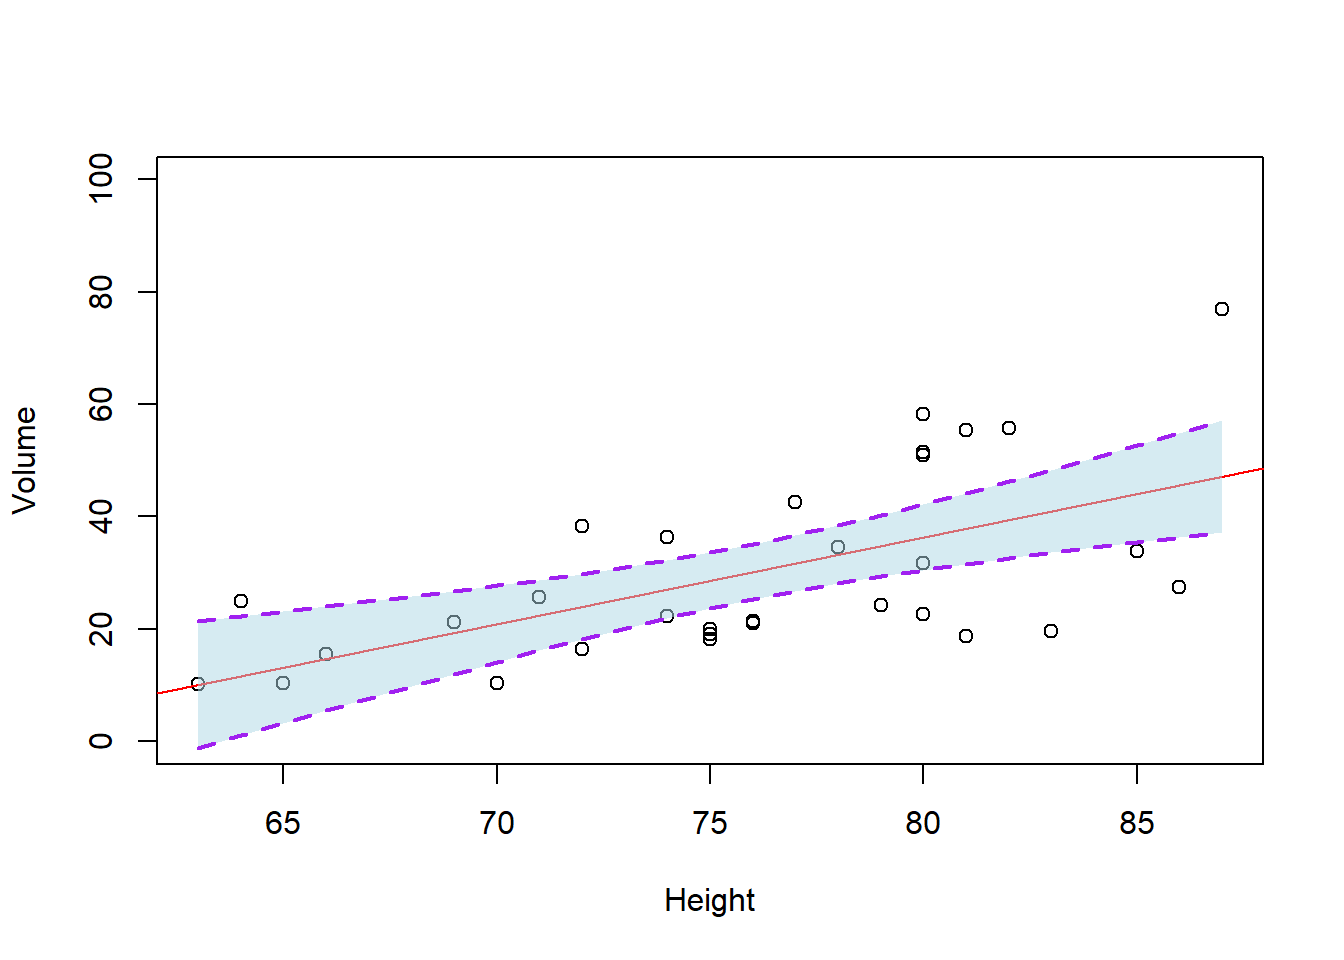
Bạn hãy vẽ đồ thị như hình bên dưới.
Để vẽ khoảng tin cậy sử dụng lệnh polygon() ta cần sắp xếp trục X (Height) theo thứ tự từ nhỏ đến lớn (hoặc ngược lại) để R vẽ đúng như yêu cầu.
library(dplyr)

df |> dplyr:::arrange(Height) -> df

plot(Volume ~ Height,
     ylim = c(0, 100),
     data = df)

fit <- lm(Volume ~ Height,
              data = df)

abline(fit, col = "red")

pred_CI <- predict(fit,
                   interval = "confidence")

# add polygon and overlplot the lines
polygon(x = c(df$Height, rev(df$Height)),
        y = c(pred_CI[ , 2], rev(pred_CI[ , 3])),
        col = adjustcolor("lightblue", alpha.f = 0.5),
        border = NA)

lines(df$Height,
      pred_CI[ , 2],
      lty = 2,
      col = "purple",
      lwd = 2)

lines(df$Height,
      pred_CI[ , 3],
      lty = 2,
      col = "purple",
      lwd = 2)